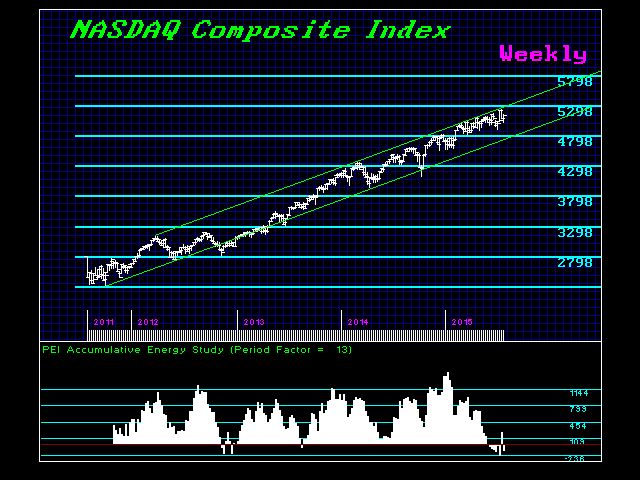
The next two months going into September will be both interesting and critical. The NASDAQ Composite made new highs in July, but the S&P500 and the Dow Jones Industrials failed to exceed May highs. The general consensus is that there will be a rate hike in September and another in December, so if we back-off from this point we may see the share market react in anticipation to the downside. This would help send cash running into the short-term government paper, making that final peak in price (low in interest rates). Thereafter, we may see the ultimate confusion as stocks rise with rising interest rates, as they did between 1927 and 1929.
Our Energy Models are turning negative on the NASDAQ weekly level. This indeed warns that we should be careful at this time. Keep in mind that this is going to be a very difficult period, for this is when we will see how worthless opinion becomes. What we are facing is something that has not emerged for nearly 300 years, so there is nobody alive who can offer an expert opinion. At this point, we will need the dispassionate analysis of Socrates to survive what is on the horizon.
Here is a sample mid-term overview report for the Indian rupee written entirely by Socrates without trading recommendations, stops, or institutional portfolio or hedging strategies. We are preparing for launch in September.
US Dollar v Indian Rupee Spot
Systemically, my broader-term observation recognizes that the current bullish trend in US Dollar v Indian Rupee Spot reflects the overall posture since 1973 which remains intact. So far, we have had a minor pull back unfold from the key high of 2013 which has held rather nicely. This market has elected 4 Monthly Bullish Reversals suggesting that this is very bullish near term and new highs are still possible in the dollar. A closing for year-end above 63.04 will also keep the bullish posture for now. Penetrating the previous major high of 68.8 will warn of a possible rally into 2016.
Broadly speaking, a month-end closing BELOW 58.27 is where the critical support lies. Only a monthly closing BELOW this level will confirm a long-term bear market is in motion. Otherwise, here lies important dynamic support within this market and holding this level is a clear line of demarcation in long-term trend. An annual closing back above 60.27 will warn that we may be off to new highs. Nevertheless, we have held last year’s low of 58.27. Only a year end closing below 58.27 will warn of a further decline ahead perhaps into 2016.
Clearly, the US Dollar v Indian Rupee Spot is in a bullish trend for now.
ECONOMIC CONFIDENCE MODEL
There are 56 days until the next ECM target, which is Wed. Sep. 30, 2015. A high forming on this precise target will warn of a correction. However, a low would imply a rally thereafter.
WEEKLY OUTLOOK
Turning to the weekly level, a weekly closing ABOVE 64.3 will warn of a continued rally ahead. We need a weekly closing back below 63.4 to suggest a retest of support is likely near-term. The Major Weekly Bearish Reversal to watch remains at 55.5. If this is penetrated on a weekly closing basis, then a correction becomes possible.
TECHNICAL OUTLOOK
Our extreme projected resistance for this month stands at 71.7. This is our normal resistance projection. Exceeding this level on a monthly closing basis would indicate we are probably entering a Phase Transition. Our Phase Transition Target resistance stands at 108.93.
MONTHLY TIMING ANALYSIS
Our primary targets on the Turning Point Model, defined as highs or lows on an intraday or closing basis, are Jul. 2015, Sep. 2015, Nov. 2015, Feb. 2016 and May. 2016
Our most critical model, the Directional Change Model targets are Sep. 2015, Dec. 2015, Feb. 2016 and Apr. 2016. This model often picks the high or low, but also a breakout to a new higher trading zone or a breakdown to a new lower trading level.
Looking at the volatility models suggest we should see a rise in price movement during Oct. 2015, Nov. 2015, Feb. 2016, Mar. 2016 and Apr. 2016
However, our Panic Cycle targets where we may see either an outside reversal or a sharp move in one direction are Sep. 2015, Oct. 2015, Nov. 2015 and Jan. 2016
POTENTIAL BIG MOVES
We do see trading gaps in our Reversals offering warnings of some potential sharp moves between them if the first Reversal is elected and you abruptly move to the next. Pay close attention to the gaps between 34.1 to 31.6, 28.3 to 26.3 and 14.9 to 13.5 beneath the market.


